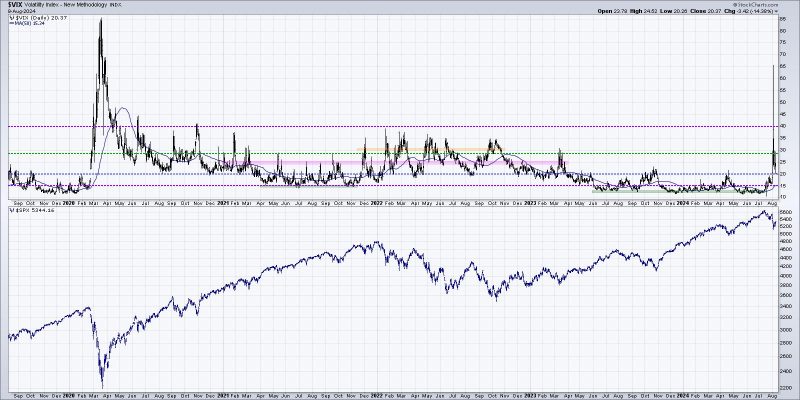
While the S&P 500 and Nasdaq experienced a decent upside bounce this week, they still remain down 3.2% and 4.4% respectively for the month of August. A quick review of market sentiment indicators tells me that further downside is much more likely before a sustainable recovery becomes a real possibility.
VIX Signals Extreme Volatility
The VIX hit 65 on an intraday basis this week, representing the third highest reading since the Great Financial Crisis in 2008. In fact, the indicator has only pushed above 40 a handful of times in the last ten years, usually during a significant corrective period.
While there is plenty of debate about how 0DTE options have impacted this classic sentiment gauge, it’s worth noting that any spike in the VIX has almost always coincided with weaker price action, at least in the short-term. So as long as the VIX remains above 20, investors should brace for a noisy tape and, most likely, further deterioration for equity indexes.
AAII Survey Shows Bulls Still Outnumber Bears
Our second indicator uses the weekly survey results from members of the American Association of Individual Investors (AAII). I tend to look for two main signals here, the first being a bullish reading of over 50%. The chart shows how this occurred in early July.
Now a high bullish reading on its own just represents extreme optimism, but it also tells me to look for signs of a bearish rotation. In the last three weeks, we’ve seen the bullish percent come down to around 41%, while the bearish reading has increased to above 38%. As the bottom panel shows, the last time that bears outnumbered bulls in the survey was at the April market low. You may also notice that more protracted market declines also started with a rotation from bullish to bearish sentiment. This chart tells me to consider the market “guilty until proven innocent”, especially if the survey results show a higher bearish reading in the coming weeks.
NAAIM Exposure Index Confirms Defensive Rotation
What about the “smart money” as represented by money managers? The NAAIM Exposure Index shows the results of a weekly survey of the National Association of Active Investment Managers, with the number representing an average allocation to equities in their client portfolios. When the indicator is above 100%, as it was in late June, it suggests a euphoric reading and a higher likelihood of corrective market action.
It’s worth noting here that the NAAIM Exposure Index was pushing lower in early July, while the AAII survey was still reading a very high level of bullishness. This suggests that the “smart money” was already lightening up equity exposure before the market decline really began to accelerate. Now, we see the indicator has come down to around 75%, confirming that money managers in this survey are finding elsewhere to park their capital to weather this period of market turbulence.
I consider an analysis of price action as the most important piece of a well-defined technical analysis process. But I also feel that market sentiment indicators can provide an excellent window into the mindset of other investors, helping to clarify when extreme optimism or pessimism may be taking hold. This analysis of three comment sentiment indicators shows remarkable similarities to previous bear phases, and tells me to brace for a potential further decline for stocks.
RR#6,
Dave
P.S. Ready to upgrade your investment process? Check out my free behavioral investing course!
David Keller, CMT
Chief Market Strategist
StockCharts.com
Disclaimer: This blog is for educational purposes only and should not be construed as financial advice. The ideas and strategies should never be used without first assessing your own personal and financial situation, or without consulting a financial professional.
The author does not have a position in mentioned securities at the time of publication. Any opinions expressed herein are solely those of the author and do not in any way represent the views or opinions of any other person or entity.


