Top Gainers
Symbol
Company Name
Price
Change
Change %
PRCT
Procept BioRobotics Corporation
91.00
+22.23
+32.33%
OKLO
Oklo Inc.
24.50
+5.39
+28.21%
DJTWW
Trump Media & Technology Group Corp.
8.73
+1.55
+21.59%
DJT
Trump Media & Technology Group Corp.
47.36
+8.41
+21.59%
NBIS
Nebius Group N.V.
23.75
+4.18
+21.36%
Top Losers
Symbol
Company Name
Price
Change
Change %
PHG
Koninklijke Philips N.V.
26.62
-5.05
-15.95%
CX
Cemex, S.A.B. de C.V.
5.46
-0.52
-8.70%
NYCB
Flagstar Finance
10.55
-0.95
-8.26%
QS
QuantumScale Corporation
5.69
-0.50
-8.08%
ADT
Adt Inc.
7.37
-0.51
-6.47%
On the 28th Oct trading session market gave a gap-up opening, indicating bullish momentum by continuing the rally in the first 15 min. Later market totally went sideways with small swings.
NYSE Composite: +93.4 (-0.48%)
Dow Jones: +273.17 (-0.65%)
S&P 500: +15.40 (+0.27%)
#1 Gainer: PRCT Stock
On October 28th, Procept BioRobotics Corporation (NASDAQ: PRCT) stock reached a new high of $91.24 during the trading session. Company value has skyrocketed by 237.14% in just one single year. With constant progress and innovation in the medical sector, the company has successfully fulfilled their promises, resulting in gaining investors’ trust.
FDA gave the green flag for a pivotal trial in prostate cancer, comparing it to Aquablation therapy to traditional radical prostatectomy. From the current development, the company is expecting $50 million in annual revenue starting from 2026, as the company has started seeing a significant 61% increase in total earnings for the second quarter of 2024, reaching $53.4 million. FDA has also approved AI-integrated treatment planning and advanced image guidance.
Technical Analysis
PRCT/USD Stock 15-Minute Chart
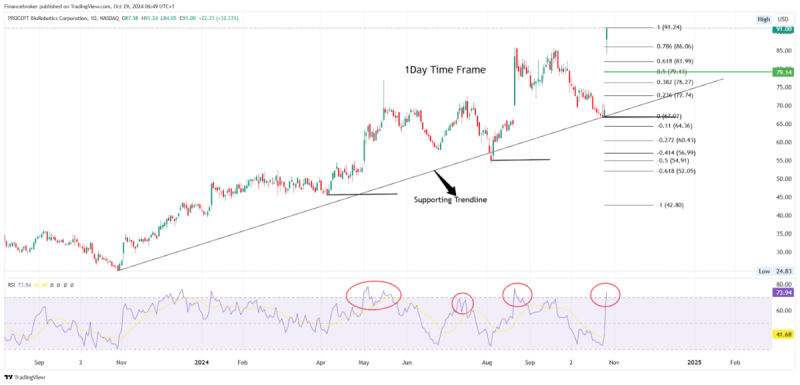
Fundamentally, the stock has a lot of strength to move upward; looking into technical aspects, we can see stock delivered a whopping 32.33% return in just one single day. The stock was in an up trend on a daily basis for a long time, indicating the strength in buying.
Yesterday, the stock opened a gap up and continued to rally upside taking RSI into the overbought zone. Looking for an entry at the current price might get difficult as the stock has made an all-time high with a big gap up space, and if we look at the historical data, then we can see price reverses from a higher level when RSI goes in the overbought zone, as shown in the image. In this situation, there are two entry points.
This can be a high-risk, reward trade. Using the Fib retracement tool from the 28th Oct high to the 25th Oct low, we can plan an entry if the price faces rejection from the 0.5 level with the stop loss below the buying candle and a target of an all-time high. As the stock is in the news, it might give a rally from this level.
This trade can give you a low-risk, high-reward ratio, as the price is moving upwards while making a swing and trend line. If the price comes to retest the supporting trend line, then an entry can be made with a stop loss below the trendline and target of all-time high.
#1 Loser: PHG Stock
Koninklijke Philips N.V. (NASDAQ: PHG) stock tanked 15% on the 28th Oct trading session. As demand from china deteriorates, Dutch cuts its 2024 sales outlook. Recently company posted its Q3 result, which fell short of expectations. Philips CEO said while there is a fall in China demand, they see growth from other regions.
There is a huge shortage in demand from hospitals and consumers from China, resulting in 3rd Quarter sales of 4.38 billion euros, which is less than compared to last year, which was 4.47 billion euros.
The investors seem to be disappointed due to low earnings and demand from the chain, resulting in huge sales.
PHG/USD 15-Minute Chart
Looking at the chart on a daily time frame, we can see the price has corrected by 15.95% in just one single day. Price was in an uptrend for a long time, taking support from the trendline while creating a rising wedge pattern. Still, on the 28th Oct trading session, the price broke the trendline on the 25th Oct trading session and continued its downward rally consecutively on the second day.
Currently, price is a channel, and making an entry based on FOMO can result in losing money, as RSI is now in an oversold zone. There are two setups in which sellers can make a position.
If the price comes to retest the $27.98 level and takes rejection, then entry can be made with a target of $25.06 and stop loss of $29.50.
On the other hand, if prices continue to fall and break the $25.09 level, then entry can be made once the price comes to retest the same level with the trailing target of $20.82 and stop loss of $27.
The post Top Stock Gainers & Losers: PRCT Stock +32%, PHG -16% Drop appeared first on FinanceBrokerage.


