


This week, we’re getting back to earnings season during the shortened four-day period.
Goldman Sachs Group, Inc. (GS) reports on the heels of JP Morgan’s solid results that saw its shares rally by 12.3% and recapture its 200-day moving average.
Watch the trading revenue numbers as added volatility should help their bottom line exceed expectations. The implied one-day move for earnings day is +/- 7.7% and, if the market is moving that morning, then expect more-than-normal movement.
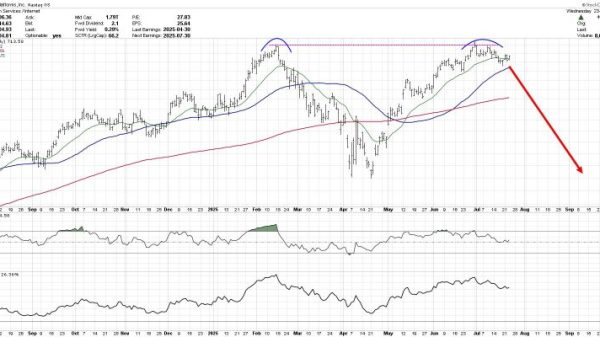
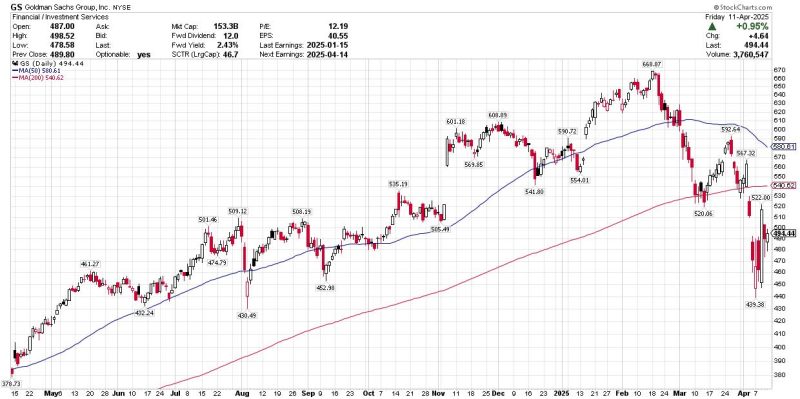
FIGURE 1. DAILY CHART OF GS. If the stock rallies watch the $520 level. A break above this level could be a positive move.
Technically, shares have been put through the wringer. GS’s stock price has broken many key trendlines and support levels along the way. Maybe, just maybe, it has found a floor.
Like most stocks in this current environment, the swings have been wild. Lines in the sand have been drawn, and maybe GS can follow JPM’s lead as the charts are similar.
Things have been extremely volatile; the range between support and resistance is wide. The $440/$450 area looks to be a strong area of support for now. However, the trend has changed, and there has been much technical damage done. There are levels of resistance above, but it seems more likely that they may get tested before any retest of the lows.
On a rally, watch the $520 level, from which it broke down after breaching its 200-day moving average. If shares eclipse that, then it will likely experience a run back to its 200-day at $540. That would take the stock’s price back to its new downtrend line and should be met with much selling pressure.
Johnson & Johnson (JNJ) has experienced some of the wildest swings since making a new high in early March. The stock price has fallen over 16%. Look for it to get back to its winning ways when the company reports on Tuesday.
Year-to-date, shares are up 5% and in one of the strongest sectors for those playing defense. Like all companies reporting, the focus will be on management’s commentary on future earnings guidance and potential impacts from global economic conditions.
FIGURE 2. DAILY CHART OF JNJ. The stock price could see more downside, or it could move up to its 200-day moving average.Technically, shares are in a bit of a no-man’s land. Price action has been streaky and now they report in the middle of this recent wide range.
The bear case is that shares have yet to reach oversold levels and test major support. They came close, but didn’t get below $140. So more of a downside could be reached before jumping into the stock.
The bull case, at a minimum, is a reversion back to the 200-day moving average, just above current levels. The best case is that it has little tariff exposure, making it a safer haven in tough times and may run back towards old highs.
Overall, outside a safe 3.3% dividend, the case to jump in for a trade is tough to make given its recent price action.
Netflix (NFLX) has given back all its gains from its last earnings cycle and hopes it can regain those levels when it reports on Thursday.
Shares are seen as a safer haven in this tariff war environment, but have not been immune to the wild market swings we have been seeing. NFLX has continued to put up solid numbers and fared better than most growth stocks during this time.
FIGURE 3. DAILY CHART OF NFLX. A head and shoulders top, bullish divergence in the RSI, and bullish MACD crossover lean toward a bullish move.
Technically, there are several more positives than negatives. NFLX’s stock price has formed a head-and-shoulders top, but failed to break its neckline at the $820 level and bounced. That was one positive development, but the pattern still hangs over the stock for now.
Secondly, there’s a bullish divergence in its relative strength index (RSI) when you compare it to recent price action. As price made new lows, the RSI did not. That indicates something has changed — this recent sell-off was not as strong as its predecessor and that a reversal may be coming.
Lastly, we may be experiencing a bullish crossover in its moving average convergence/divergence (MACD). While we always want confirmation, sometimes anticipating the move may be worth the risk. When tied into the above two factors, I believe it is.
The stock has a history of gaps after earnings, so watch that gap and price action immediately afterward. If NFLX experiences a gap higher and above the 50-day moving average, you can use that as a stop to manage risk. To the downside, watch to see if the $820 level holds. If it doesn’t, there could be an accelerated move to the downside.